Rossana Babakhani ← Back to work
Case Study

Report Composer

Report Composer is a reporting tool I designed at Clinisys, application-agnostic by design so it could serve the whole product portfolio rather than one product line, to close a real gap: laboratory systems capture enormous amounts of valuable data, but clients had a subpar experience getting that data back out and using it for reporting. Laboratory users are domain experts, not reporting or data specialists, so the central challenge was giving them sophisticated reporting capability without the complexity of a traditional report-development application. Its defining capability: editing a field on a generated report writes the correction back to the source record, not just the document.

RoleUX Research / Design
PlatformReport Composer (Clinisys)
Timeline2022 (~4 months); revisited 2025
StatusPrototyped and demoed; shelved before development completed
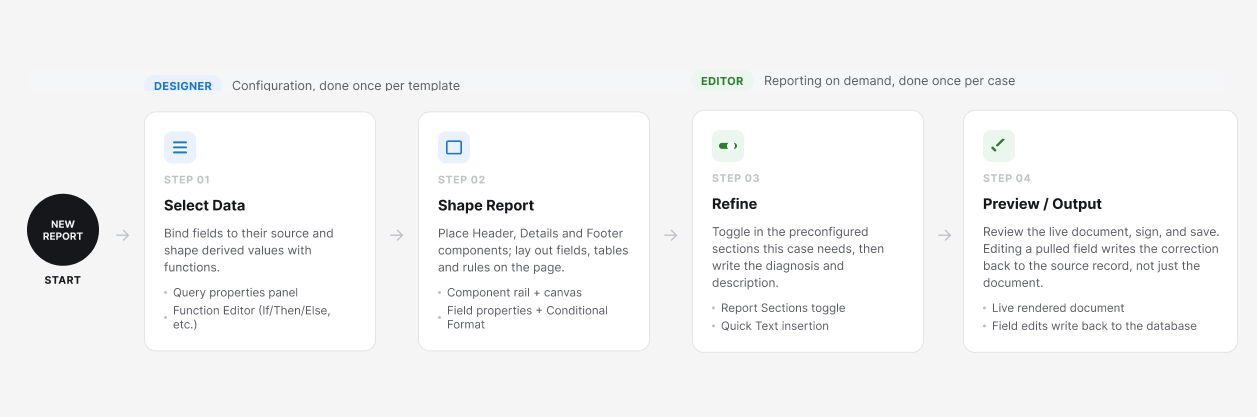
Workflow diagram showing the Designer phase steps, Select Data and Shape Report, flowing into the Editor phase steps, Refine and Preview/Output

Clinisys needed a more sustainable approach to reporting. Laboratory applications captured substantial amounts of clinical, scientific, and operational data, but reporting capabilities had evolved unevenly across the product portfolio. Some organizations supplemented those limitations with external analytics tools, while others relied primarily on the reporting options available within their laboratory systems.

The Report Composer project explored a shared, application-agnostic reporting capability that could eventually support CLS and other Clinisys products. Rather than begin with a predefined feature set, I first mapped the broader reporting capability landscape and evaluated how those capabilities changed across three increasingly complex reporting contexts: Patient, Scientific, and Management reporting.

That analysis shaped both the scope and the interaction model. Capabilities that laboratory users needed to control remained visible and direct. Technical concerns such as data relationships, validation, permissions, and query processing could be managed by the system. Analytics and visualization capabilities that extended beyond report authoring could remain part of a broader future data ecosystem.

I partnered with Product, Architecture, and subject-matter experts across Clinical Pathology and Anatomic Pathology to translate that strategy into a prototype. The concept included reusable report components, shared report libraries, a publish workflow, separate Designer and Editor experiences, and a write-back capability that allowed authorized corrections made from a generated report to update the underlying source record.

The prototype was demonstrated to a client and received positive interest, but the project was shelved before development was completed. I revisited the work in 2025 to reconstruct portions of the original research, refine the information architecture and terminology, and modernize the visual design.


RoleUX Research / Design
Timeline2022 · approximately four months
Revisited in 2025
TeamProduct · Architecture · Clinical Pathology SMEs · Anatomic Pathology SMEs
ResearchCompetitive analysis · Reporting functionality taxonomy · Reporting capability analysis
Key ContributionDefined reporting scope according to data complexity and designed a write-back model that allowed authorized corrections made within a report to update the source record.
OutcomePrototype demonstrated to a client and received with interest. The project was shelved before implementation and was not validated through production use.

Contributions

  • Built a solution-neutral taxonomy of reporting functionality before making any product decisions
  • Ran a capability analysis scoring what a nontechnical lab user needed to control directly, versus what the system could safely manage, across Patient, Scientific, and Management reporting
  • Partnered with product, architecture, and subject-matter experts across Clinical Pathology and Anatomic Pathology, and benchmarked comparable self-service reporting products
  • Designed the reusable Header, Details, and Footer component model, and the Site and Global libraries that store, version, and publish them
  • Designed the write-back editing capability that lets a user correct pulled data directly on a live report
  • For this case study: reconstructed research lost to a hard drive failure, resolved a long-standing naming collision, and modernized the visual system

Method

I followed the same order the analysis itself is structured in: map the full landscape of what a reporting platform could do, solution-neutral, before deciding anything.

That meant building a taxonomy first, solution-neutral, before deciding anything, and then scoring each capability against how the underlying data grows in complexity: a single patient record, a scientific case or batch, or an entire population of laboratory activity.

Revisiting the prototype in 2025 for this case study, I could evaluate the same decisions with fresh eyes, and confirm which of them still held up.

Reporting Across the Product Portfolio

Reporting had remained a difficult product area for Clinisys. Previous approaches had addressed parts of the problem, but no single solution had become a durable answer across the product portfolio.

At the same time, laboratory systems contained valuable information extending well beyond individual test results. That data could support patient communication, scientific investigation, operational oversight, quality management, and organizational decision-making.

The challenge was that the people who needed those answers were laboratory professionals, not necessarily database specialists or report developers.

A laboratory user could describe the information they needed:

  • a patient's results
  • a scientific case or batch
  • activity across a laboratory
  • turnaround performance
  • workload by discipline
  • trends over time

They should not also have to determine the joins, query structure, aggregation rules, permissions, or data architecture required to produce the report.

The project therefore addressed a broader question than how to redesign an existing reporting interface:

How could Clinisys provide increasingly sophisticated reporting capabilities without requiring laboratory users to become reporting or data specialists?

Supporting Research View the competitive analysis ↗

Competitive Analysis: How Other Products Reduce Reporting Complexity

I also reviewed reporting experiences designed for business and nontechnical users, including Airtable, Smartsheet, Salesforce, HubSpot, and Zoho Analytics.

The objective was not to compare feature counts. I examined how each product reduced the amount of reporting-engine knowledge required from the person creating the report.

The analysis focused on:

  • selecting data and fields
  • filtering
  • grouping and summarizing
  • previewing results
  • terminology
  • progressive disclosure
  • system-assisted configuration

Several recurring patterns emerged.

Hide The Data Model

Products such as Airtable demonstrate that users can work with related information without being exposed to the full relational structure underneath it.

Make Configuration Incremental

Salesforce attaches actions such as filtering, grouping, and summarization to the objects they affect, allowing complexity to appear as it becomes relevant.

Turn Report Creation Into A Sequence

HubSpot structures reporting as a progression from selecting data, to choosing fields, refining the result, and saving the report. Users are not required to understand the entire reporting environment before they can begin.

The competitive analysis supported the same direction that emerged from the capability analysis: reporting can remain sophisticated while the interface selectively exposes that sophistication.

Capability Analysis View the Reporting Capability Analysis ↗

Reporting Capability Analysis: Mapping the Landscape Before Defining Scope

Before deciding what Report Composer should contain, I created a solution-neutral taxonomy of reporting functionality. The purpose was to establish the broader capability landscape first, not to classify features as required or unnecessary.

The taxonomy organized reporting functionality into seven domains: Data; Query & Selection; Organization & Logic; Report Design; Output & Delivery; Management & Governance; Platform. Within those domains were capabilities ranging from field selection, filtering, grouping, and calculated values to distribution, permissions, performance, data relationships, and developer-level functionality.

View the Reporting Functionality Taxonomy diagram ↗

The capability analysis then addressed the more important question: what did Report Composer need to support, and how should that capability be presented?

Reporting Complexity Model

The product was planned around three reporting contexts. These were not simply feature releases. Each represented a different underlying data structure.

Patient Reporting

Single record and related clinical data. Patient → Encounter → Test → Result → Related Data. Patient reporting begins from a known record and follows established relationships around that patient. The dataset is comparatively bounded and predictable.

Scientific Reporting

Case or batch. Scientific reporting may involve a single case or multiple specimens or cases processed together. The reporting problem expands to include larger datasets, more relationships, grouping, aggregation, calculations, comparison, and more sophisticated filtering.

Management Reporting

Population and organization. Management reporting extends across disciplines, laboratories, employees, workloads, quality measures, time periods, and other operational dimensions. The questions move from what happened to this patient, to what is happening across the laboratory.

Patient

Single record + related data.

Scientific

Case or batch + larger related datasets.

Management

Population + organizational dimensions + aggregated data.

The reporting capabilities needed to expand because the structure, volume, and questions associated with the data expanded.

Key Findings

Necessary Capability Did Not Mean Necessary User Complexity

A report may require joins, relationship validation, permission checks, or query optimization. That does not mean the person building the report needs to configure those mechanisms. The analysis distinguished between what the product must do and what the user must control.

Data Should Drive Scope

Patient, Scientific, and Management reporting represented progressively broader reporting problems. The roadmap therefore followed the data rather than an arbitrary list of requested features.

Requests Did Not Define The Entire Requirement

Laboratory professionals could describe the information they needed and the questions they wanted to answer. The product still needed to translate those outcomes into the technical capabilities required to retrieve and organize the data correctly.

Reporting And Analytics Were Related But Distinct

Report Composer was intended to operate within a broader, application-agnostic data strategy. Structured report authoring belonged in Report Composer. Dashboards, exploratory visualization, drill-down analysis, and other analytical experiences could be supported by future visualization products without turning Report Composer itself into an analytics platform.

Both pieces of research pointed to the same six principles.

01 · Scope by Data Complexity

Expand capability as reporting moves from a patient record, to scientific cases and batches, to organizational reporting.

02 · Put Complexity in the Appropriate Layer

Expose controls users need. Allow the platform to manage technical concerns it can reliably resolve.

03 · Translate Outcomes Into Capabilities

Use the reporting outcome to determine the underlying functionality required rather than expecting users to define the technical solution.

04 · Handle Relationships Automatically Where Possible

Users need related information. They do not necessarily need to understand or configure relational joins.

05 · Reveal Advanced Capability Progressively

Advanced filtering, calculations, formatting, and logic remain available without becoming prerequisites for basic report creation.

06 · Use Laboratory Language

Present concepts such as Patient, Specimen, Test, and Result instead of requiring users to work primarily in database or reporting-engine terminology.

One Continuous Journey, Two Tools

The capability analysis's reporting journey, Select Data, Shape Report, Refine, Preview/Output, maps cleanly onto two tools instead of requiring either one to do both jobs.

Designer, configuration, once per report design

Select Data: bind fields to their source, shape derived values with functions.
Shape Report: place Header, Details, and Footer; lay out fields, tables, and rules.

Editor, reporting on demand, once per case

Refine: toggle in the sections this case needs, then write the diagnosis and description.
Preview/Output: review the live document, correct pulled data in place if needed, sign, and save.

Workflow diagram showing Start leading into Designer's Select Data and Shape Report steps, then into Editor's Refine and Preview/Output steps

Designer never needed a live preview tab, because it was never producing a report. It was producing the raw material a report gets assembled from. Editor never needed an abstract wireframe canvas, because every choice it offers, including a correction to the source data, is already sitting on a real, signable document.

Reporting Flow

Three Connected Areas

Report Composer was organized into three connected areas: Content Management, Report Designer, and Report Editor. Together, they supported the report from creation and management through authoring, release, and addendum.

Content Management

Create · Store · Version · Share · Publish

Report Designer

Add Components · Configure Data · Structure Report

Report Editor

Auto-populate Data · Enter Content · Format · Add/Remove Sections

Release / Addendum

Confirm to Record · Send to Referring Physician

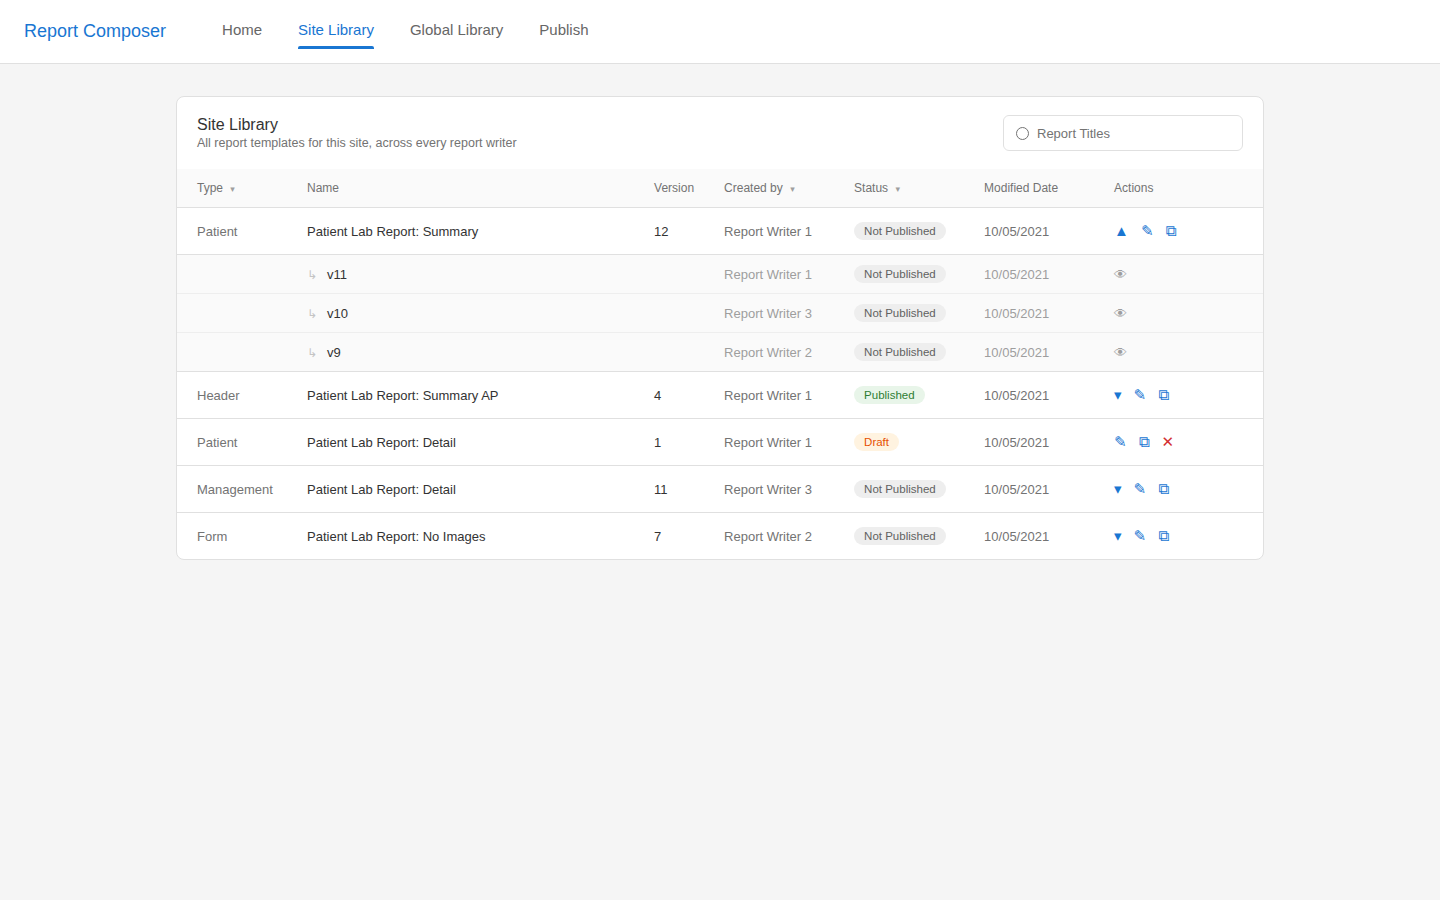
Site Library screen listing report designs and components with version numbers and publish status

01. Content Management

Content Management is where reports and their components are stored, managed, shared, versioned, and published.

A Report is composed of one or more Headers, Details, and Footers. These components can also be created and saved separately, allowing them to be used across different reports.

  • HomeThe user's files and recently accessed reports and components.
  • Site FilesReports and components shared within the user's organization.
  • Global LibraryComponents shared by Clinisys and other client organizations.
  • VersioningReports maintain versions as changes are made.
  • PublishReports can be published when they are ready for use and unpublished when they should no longer be available.
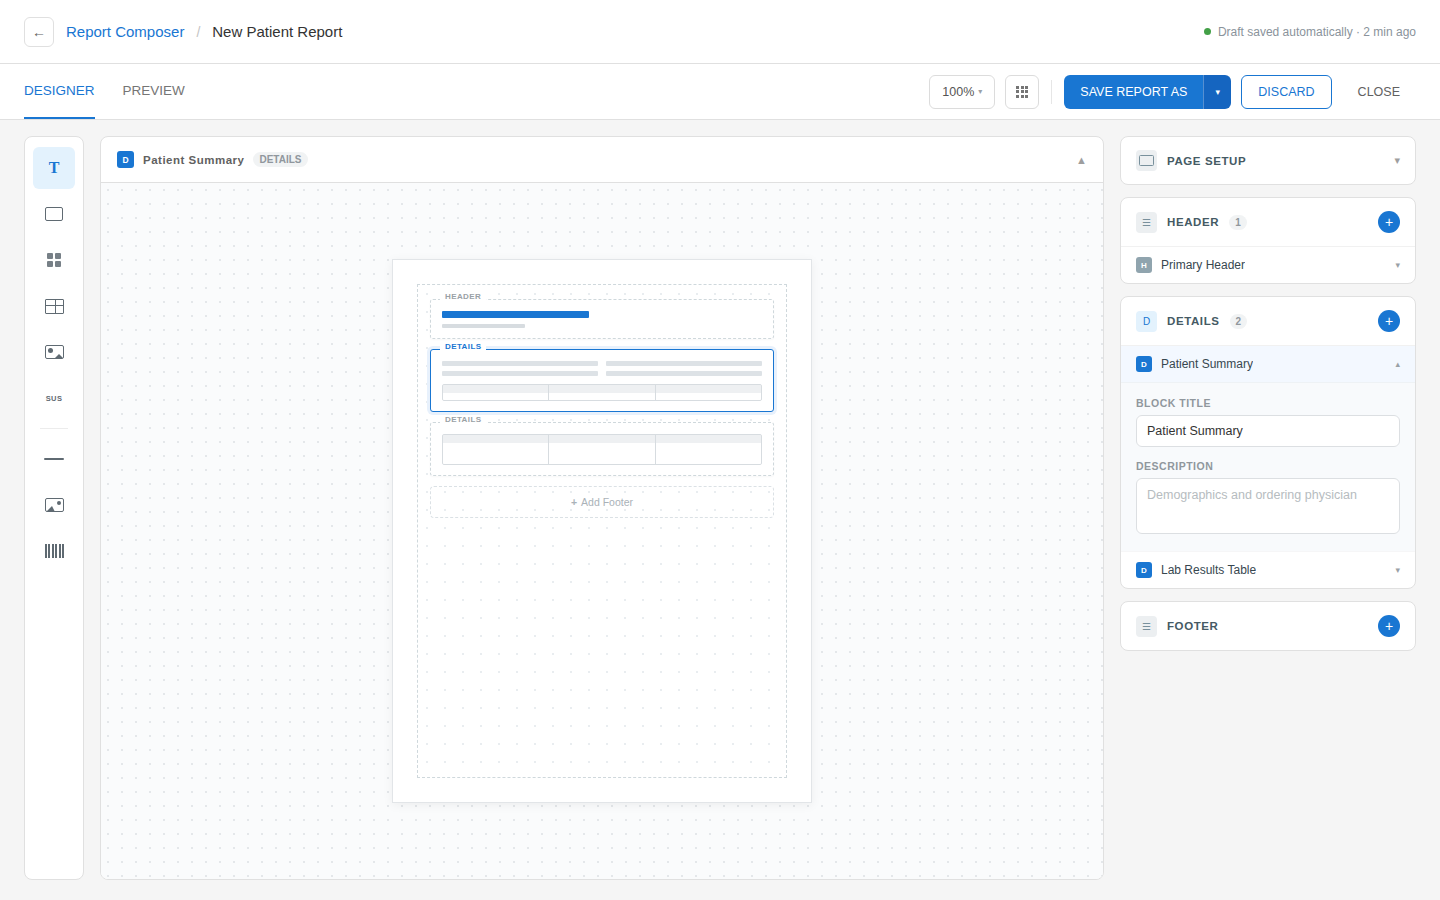
Report Designer screen with component rail, canvas showing Header and Details blocks, and a properties panel on the right

02. Report Designer

The Report Designer is where reports are designed and configured.

Users build the report structure by adding:

Headers · Details · Footers

A report can contain multiple Headers, Details, and Footers depending on its content and structure.

The Designer toolbar provides the elements used to construct the report:

Text · Field · Function · Table · Image · Line Divider · Page Break · Groups · Optional Sections

Fields connect the report to laboratory data. Functions provide calculations and logic. Tables and groups organize information, while Optional Sections define content that can be included or excluded when the report is completed.

The Designer determines the structure, data, content, and presentation of the report before it is used in the Report Editor.

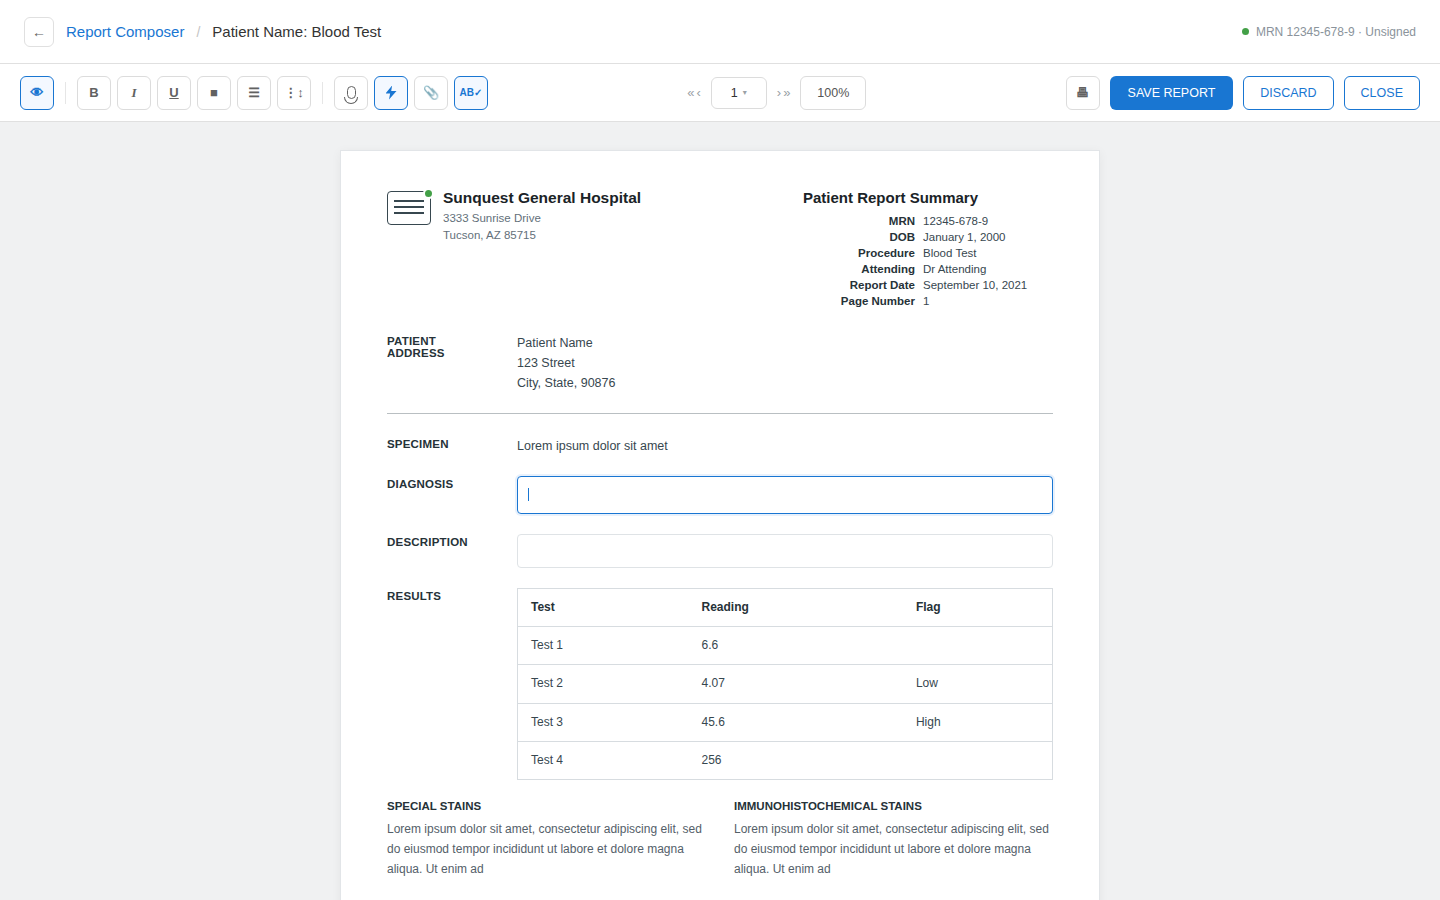
Report Editor screen showing a live patient report with read-only Specimen data and an editable, focused Diagnosis field

03. Report Editor

The Report Editor is where a report is completed for an actual patient or case.

When the report is opened, applicable data is automatically populated from the laboratory record. Designated fields remain available for data entry, allowing users to add information that is created as part of the reporting process.

Entry fields expand based on their content rather than restricting users to a fixed field size.

Within the Editor, users can:

  • enter data in designated fields
  • format text
  • add or remove Optional Sections
  • insert Quick Text
  • save work in progress
  • release the completed report
  • add an addendum after release
  • ReleaseRelease confirms the report data to the underlying record and sends the report to the referring physician.
  • Save as AddendumWhen additional information needs to be added after release, Save as Addendum records the addendum without replacing the previously released information. The addendum is confirmed to the record and the report is sent to the referring physician again.

The prototype was demonstrated to a client, generating interest in the concept.

The project was subsequently shelved before development was completed. Report Composer was therefore not implemented and was not validated through production use.

I revisited the work in 2025 to reconstruct portions of the original research, modernize the visual system, reconsider the terminology, and evaluate the original product decisions with the benefit of additional distance from the project.

The central strategy remained consistent: reporting capability should grow with the complexity of the underlying data, while the interface should expose only the complexity laboratory users actually need to manage.

Report Composer addressed a longstanding reporting opportunity within the Clinisys product portfolio.

The project began by separating two questions that are often treated as one:

What does a reporting platform need to be capable of?

and

Which of those capabilities should a laboratory user actually have to manage?

The taxonomy established the broader reporting landscape. The capability analysis then evaluated that landscape against increasingly complex Patient, Scientific, and Management reporting contexts.

That distinction shaped the product, from automated data relationships and progressive configuration to reusable report designs, separate Designer and Editor workflows, and the ability to correct source-linked data directly within the report.

The objective was not to reduce reporting capability. It was to provide sophisticated reporting while keeping the technical mechanics in the parts of the system best equipped to manage them.